

Key Takeaways
- PageSpeed Insights helps optimize web performance for real users
- Core Web Vitals (LCP, INP, CLS) are critical for both user experience and SEO
- Always analyze and optimize mobile and desktop results separately
- Scores in Performance, Accessibility, Best Practices, and SEO highlight unique improvement areas
- Continuous monitoring and collaboration between teams ensure lasting performance gains
Join 473+ Founders & Marketing Leaders for tips, strategies, and resources to scale your business.
PageSpeed Insights Overview
What Is PageSpeed Insights?
PageSpeed Insights is a Google tool that evaluates the performance of web pages on both mobile and desktop devices, offering suggestions to improve speed, accessibility, and SEO.
Page Speed URL - https://pagespeed.web.dev/
“PageSpeed Insights bridges the gap between technical performance and real-world user experience.”
Why PageSpeed Insights Matters
- Enhances user satisfaction and engagement
- Directly influences search engine rankings
- Impacts conversion rates and revenue
- Identifies actionable areas for website improvements
Pro Tip
Analyze both mobile and desktop results separately. Users’ experiences can differ dramatically between devices, and so should your optimization strategies.
How PSI Works
- Fetches your page and runs a series of performance tests
- Measures both lab data (simulated) and field data (real users)
- Provides scores and recommendations across Performance, Accessibility, Best Practices, and SEO
Mobile vs. Desktop Insights: What’s the Difference?
Device-Specific Metrics
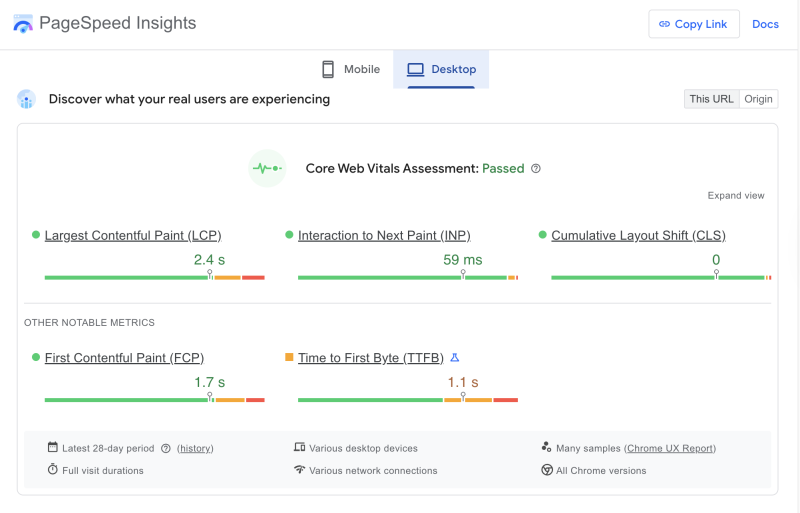
PageSpeed Insights evaluates mobile and desktop versions of your site separately, reflecting the distinct challenges and opportunities on each platform.
“Mobile users expect instant access—every extra second of load time can cost you conversions.”
Mobile Insights
- Simulates mid-tier devices on 4G networks
- Emphasizes touch-friendly navigation and responsive design
- Highlights issues like large images, blocking scripts, and slow server responses
Desktop Insights
- Assumes higher processing power and faster internet
- Focuses on desktop-specific layouts and resource demands
- Exposes issues hidden from mobile, such as oversized images for high-res screens
Did You Know?
Google crawls and indexes most sites as mobile-first, making mobile performance crucial for SEO.
Practical Takeaways
- Always check both mobile and desktop scores
- Optimize for the lowest-performing device first
- Consider user demographics: are your visitors mostly mobile or desktop?
Core Web Vitals Assessment Demystified
Understanding Core Web Vitals
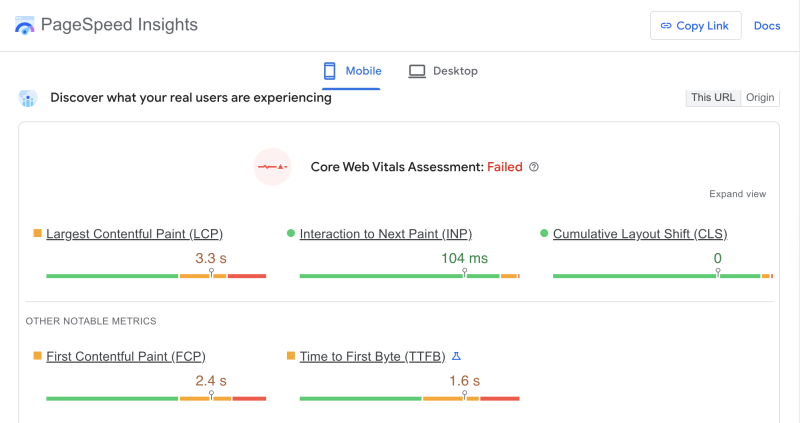
Core Web Vitals are a set of Google metrics that measure key aspects of user experience, focusing on loading, interactivity, and visual stability.
“Core Web Vitals are the heartbeat of modern web performance—they shape both user experience and search visibility.”
Key Metrics Explained
Largest Contentful Paint (LCP):
- Measures loading performance
- How long it takes for the main content to appear
- Ideal: under 2.5 seconds
- Learn More about LCP
Interaction to Next Paint (INP):
- Measures overall responsiveness
- How quickly the page reacts to user interactions
- Ideal: under 200ms
- Learn More about INP
Cumulative Layout Shift (CLS):
- Measures visual stability
- How often the layout shifts unexpectedly
- Ideal: less than 0.1
- Learn More about CLS
First Contentful Paint (FCP):
- Time until the first visible element appears
- Early indicator of perceived performance
- Learn More about FCP
Time to First Byte (TTFB):
- Time taken for the server to send first data byte
- Reflects server speed and hosting quality
- Learn More about TTFB
Pro Tip
Improving Core Web Vitals is not just a technical task—it’s a competitive advantage for your business.
Common Issues Affecting Core Web Vitals
- Slow server response times
- Render-blocking resources (JavaScript, CSS)
- Unoptimized images
- Poorly structured HTML
- Third-party scripts
How to Improve Core Web Vitals
- Use a fast, reliable hosting provider
- Implement lazy loading for images
- Minify CSS and JavaScript
- Reserve space for images and ads to prevent layout shifts
- Limit third-party scripts and plugins
Decoding PageSpeed Insights Scores
Score Categories Explained
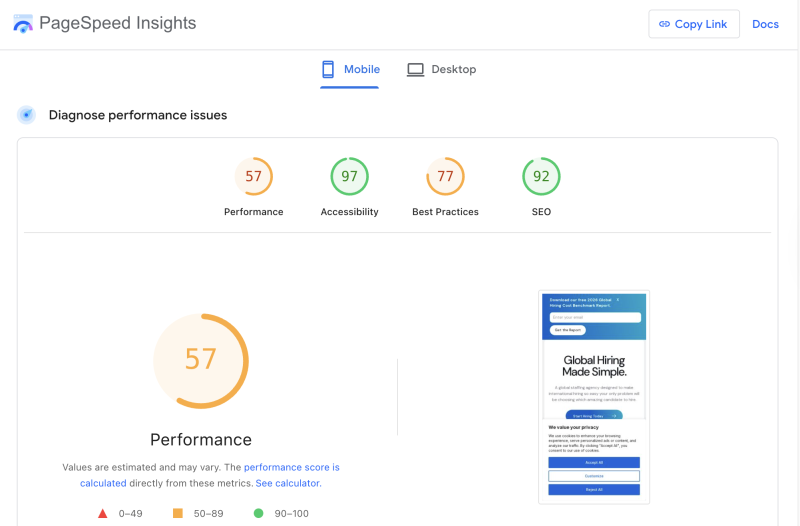
PageSpeed Insights provides four main scores—each reflecting a different aspect of your site’s performance.
“Don’t just chase high scores—focus on meaningful improvements that matter to your users.”
Performance
- Measures load speed and interactivity
- Based on Core Web Vitals and other metrics
- Score above 90 is considered good
Accessibility
- Evaluates how usable your site is for people with disabilities
- Checks for color contrast, alt text, keyboard navigation
- Essential for inclusivity and legal compliance
Best Practices
- Checks site security and modern web standards
- Flags issues like outdated libraries, insecure resources
SEO
- Assesses basic search optimization factors
- Looks for meta tags, mobile-friendliness, and structured data
How Scores Are Calculated
- Scores range from 0 to 100, color-coded (red/yellow/green)
- Combine lab and field data for a holistic picture
- Real user data prioritized when available
Did You Know?
A high score in Accessibility and Best Practices can improve trust and credibility with users and partners.
Score Improvement Checklist
- Fix opportunities and diagnostics listed in the PSI report
- Regularly monitor scores as you update your site
- Use Google Search Console for deeper field data
Actionable Optimization Strategies
Quick Wins for Better Scores
- Compress and resize images
- Eliminate unnecessary plugins
- Enable browser caching
- Use a Content Delivery Network (CDN)
- Minify and defer JavaScript
Pro Tip
Start with optimizations that have the biggest impact on loading times—often, images and scripts are the main culprits.
Continuous Improvement
- Schedule monthly site audits with PSI
- Keep CMS, plugins, and third-party tools up to date
- Monitor Core Web Vitals in Google Search Console
Collaboration Tips
- Work closely with developers to implement technical fixes
- Communicate improvements to stakeholders using easy-to-understand metrics
- Prioritize user experience in every web update
Common Mistakes to Avoid
- Ignoring mobile performance
- Overlooking accessibility
- Focusing only on desktop or lab data
- Neglecting server-side optimizations
[BONUS] Understanding Performance Insights
The “Performance insights” section in PageSpeed Insights and Chrome DevTools highlights concrete opportunities to speed up how your page loads and responds for real users.
The audits point at specific network, rendering, font, and image issues, each with an estimated time or kilobyte saving if you fix them.
Use efficient cache lifetimes
“Use efficient cache lifetimes” flags static assets (like CSS, JS, images, fonts) that are either not cached or have very short cache-control headers.
By giving these files a long cache lifetime (for example 30 days or more), repeat visitors can load them from the browser cache instead of the network, which cuts latency and bandwidth use.
Render blocking requests
“Render blocking requests” shows CSS and JavaScript files that block the browser from painting content until they have finished loading and executing.
Reducing, inlining, deferring, or asynchronously loading these resources lets the browser show above‑the‑fold content sooner and improves metrics like First Contentful Paint (FCP) and Largest Contentful Paint (LCP).
Forced reflow
“Forced reflow” (also called forced layout) appears when JavaScript repeatedly reads layout information and then writes style or DOM changes that make the browser recalculate layouts many times.
Cleaning up these scripts, batching DOM changes, or using more efficient layout patterns reduces main‑thread work and prevents janky scrolling or interactions.
LCP request discovery
“LCP request discovery” focuses on how quickly the browser can find and start loading the resource used for Largest Contentful Paint, usually the hero image or main heading.
It checks whether the LCP image or element is in the initial HTML, not lazily loaded, and prioritized (for example with fetchpriority="high"), so the main content becomes visible as early as possible.
Network dependency tree
“Network dependency tree” visualizes how your page’s network requests depend on each other, showing chains where one request must finish before others can begin.
Long or inefficient chains (for example, multiple CSS/JS files loaded sequentially) delay rendering; simplifying these dependencies or loading more resources in parallel can significantly speed up the page.
Font display
The “Font display” insight looks at how web fonts load and whether they block text from appearing while the font file downloads.
Using appropriate font-display values (such as swap) and optimizing font files helps ensure that text appears quickly, improving perceived performance and avoiding invisible text during load.
Improve image delivery
“Improve image delivery” highlights images that could be compressed more, resized, or served in modern formats like WebP or AVIF.
Optimizing these images and matching their dimensions to their display size reduces total page weight, improves LCP, and lowers bandwidth usage, especially on mobile connections.
Other insights
Additional entries like “Layout shift culprits,” “LCP breakdown,” and “3rd parties” provide deeper diagnostics about which elements cause layout jumps, how the total LCP time is composed, and how external scripts or tags affect performance.
These help you prioritize the most impactful fixes by showing exactly where layout instability or third‑party scripts slow things down.
[BONUS] Understanding Performance Diagnostics
The “Diagnostics” section in PageSpeed Insights surfaces lower‑level technical issues that may not always break your Core Web Vitals scores but still slow down how the page loads and feels.
Each item highlights a specific area of your front‑end code or network usage, with estimates of how much time or data you could save by fixing it.
Minimize main‑thread work
“Minimize main‑thread work” indicates that the browser’s main thread is busy for too long executing JavaScript, parsing HTML/CSS, and performing layout and paint operations.
Reducing expensive scripts, splitting large bundles, and offloading non‑critical work to web workers helps shorten main‑thread time and makes the page respond faster to user input.
Reduce unused JavaScript and CSS
“Reduce unused JavaScript” and “Reduce unused CSS” show that large portions of your JS and stylesheets are not actually needed for the current page view.
Removing unused code, loading scripts/styles only where they are required, and code‑splitting can significantly shrink download sizes and speed up parsing and execution.
Image elements missing width and height
The “Image elements do not have explicit width and height” diagnostic appears when images lack size attributes, forcing the browser to recalculate layout once the actual dimensions are known.
Setting explicit width and height (or using CSS aspect‑ratio) reserves space in advance, which reduces layout shifts and makes the page appear more stable as it loads.
Minify CSS and JavaScript
“Minify CSS” and “Minify JavaScript” indicate that your styles and scripts still contain unnecessary characters such as whitespace, comments, and line breaks.
Running these files through a minifier or build process compresses them without changing behavior, reducing transfer size and improving load times.
Avoid enormous network payloads
“Avoid enormous network payloads” warns that the total bytes transferred for the page are very high, often due to heavy images, large JS/CSS bundles, or uncompressed assets.
Compressing and resizing images, trimming or deferring non‑essential scripts/styles, and enabling compression and caching all help bring the overall payload down.
Avoid long main‑thread tasks
“Avoid long main‑thread tasks” points to individual JavaScript tasks that run for a long time without yielding, which can freeze the UI and increase input delay.
Breaking these tasks into smaller chunks, deferring non‑critical logic, or moving work off the main thread keeps the interface smoother and more responsive.
Avoid non‑composited animations
The “Avoid non‑composited animations” diagnostic appears when animations are handled by the main thread instead of the GPU compositor, often because they animate non‑transform or non‑opacity properties.
Restricting animations to properties like transform and opacity, and using CSS animations where possible, allows smoother, GPU‑accelerated motion.

Frequently Asked Questions (FAQ)
What is a good PageSpeed Insights score?
A score above 90 is considered excellent, but always prioritize user experience over chasing perfect scores.
Why do my mobile and desktop scores differ?
They reflect different device capabilities and user contexts. Optimize for both, focusing on your primary audience.
How often should I check PageSpeed Insights?
Regularly—at least once a month, and after every major website update or redesign.
Does a higher PSI score boost my SEO?
Directly, no—but improved performance, accessibility, and Core Web Vitals strongly influence search rankings.
Can third-party scripts affect my scores?
Yes, especially for loading speed and interactivity. Audit and minimize third-party scripts wherever possible.
You may also like the below Video Course

Conclusion
Optimizing your website with PageSpeed Insights is an ongoing process that pays off in improved user experience, higher search visibility, and better business outcomes. Focus on Core Web Vitals, address both mobile and desktop needs, and make use of PSI’s actionable recommendations to build a faster, more accessible, and resilient web presence.
“In the race for digital growth, every millisecond matters. Invest in speed, and you invest in your users.”
Want to Scale your SEO initiatives?
Need a SEO growth partner who can build the same automation, paid acquisition, and retention systems we architect for our marketing automation and growth retainers? We help leaders scale repeatable revenue engines in SEO without adding bloated headcount.
Talk to us about plugging our expert team into your roadmap—no pressure, just a candid conversation about how we can automate, optimize, and grow faster together.